Glossary
- Affordable Units
- Units in the development that are designated affordable by the governing land use body. This does not account for relative affordability, only those designated affordable. This variable includes all units identified as affordable by any designation (i.e., 60%, 80%) as a percent of all units (regardless of occupancy). Observations show that as percent of affordable units goes up, parking/unit ratio goes down.
- Bedroom Count, Average Occupied (variable):
- The average of the number of bedrooms in all occupied units is used to calculate this variable. Studio units were assumed to have a bedroom count of one. Observations show that as bedroom count goes up, parking/unit ratio goes up.
- Building provides transit information
- Obtained from property managers, this variable is defined by weather the building provided information on local transit service. Observations show that if this information is provided the parking/unit ratio also goes down.
- Custom Building:
- Eight of the variables in the final model are specific to the building and obtained from field work. Specific data for these variables are not available for all parcels. The calculator uses one of three prototypical building, with values from the field work sample for these variables, as default when you first choose a parcel. By choosing the custom building values for rent and residential area are automatically input using the specifications from the average of the medium buildings in the surveyed data, and the user is required to input the number of units by type.
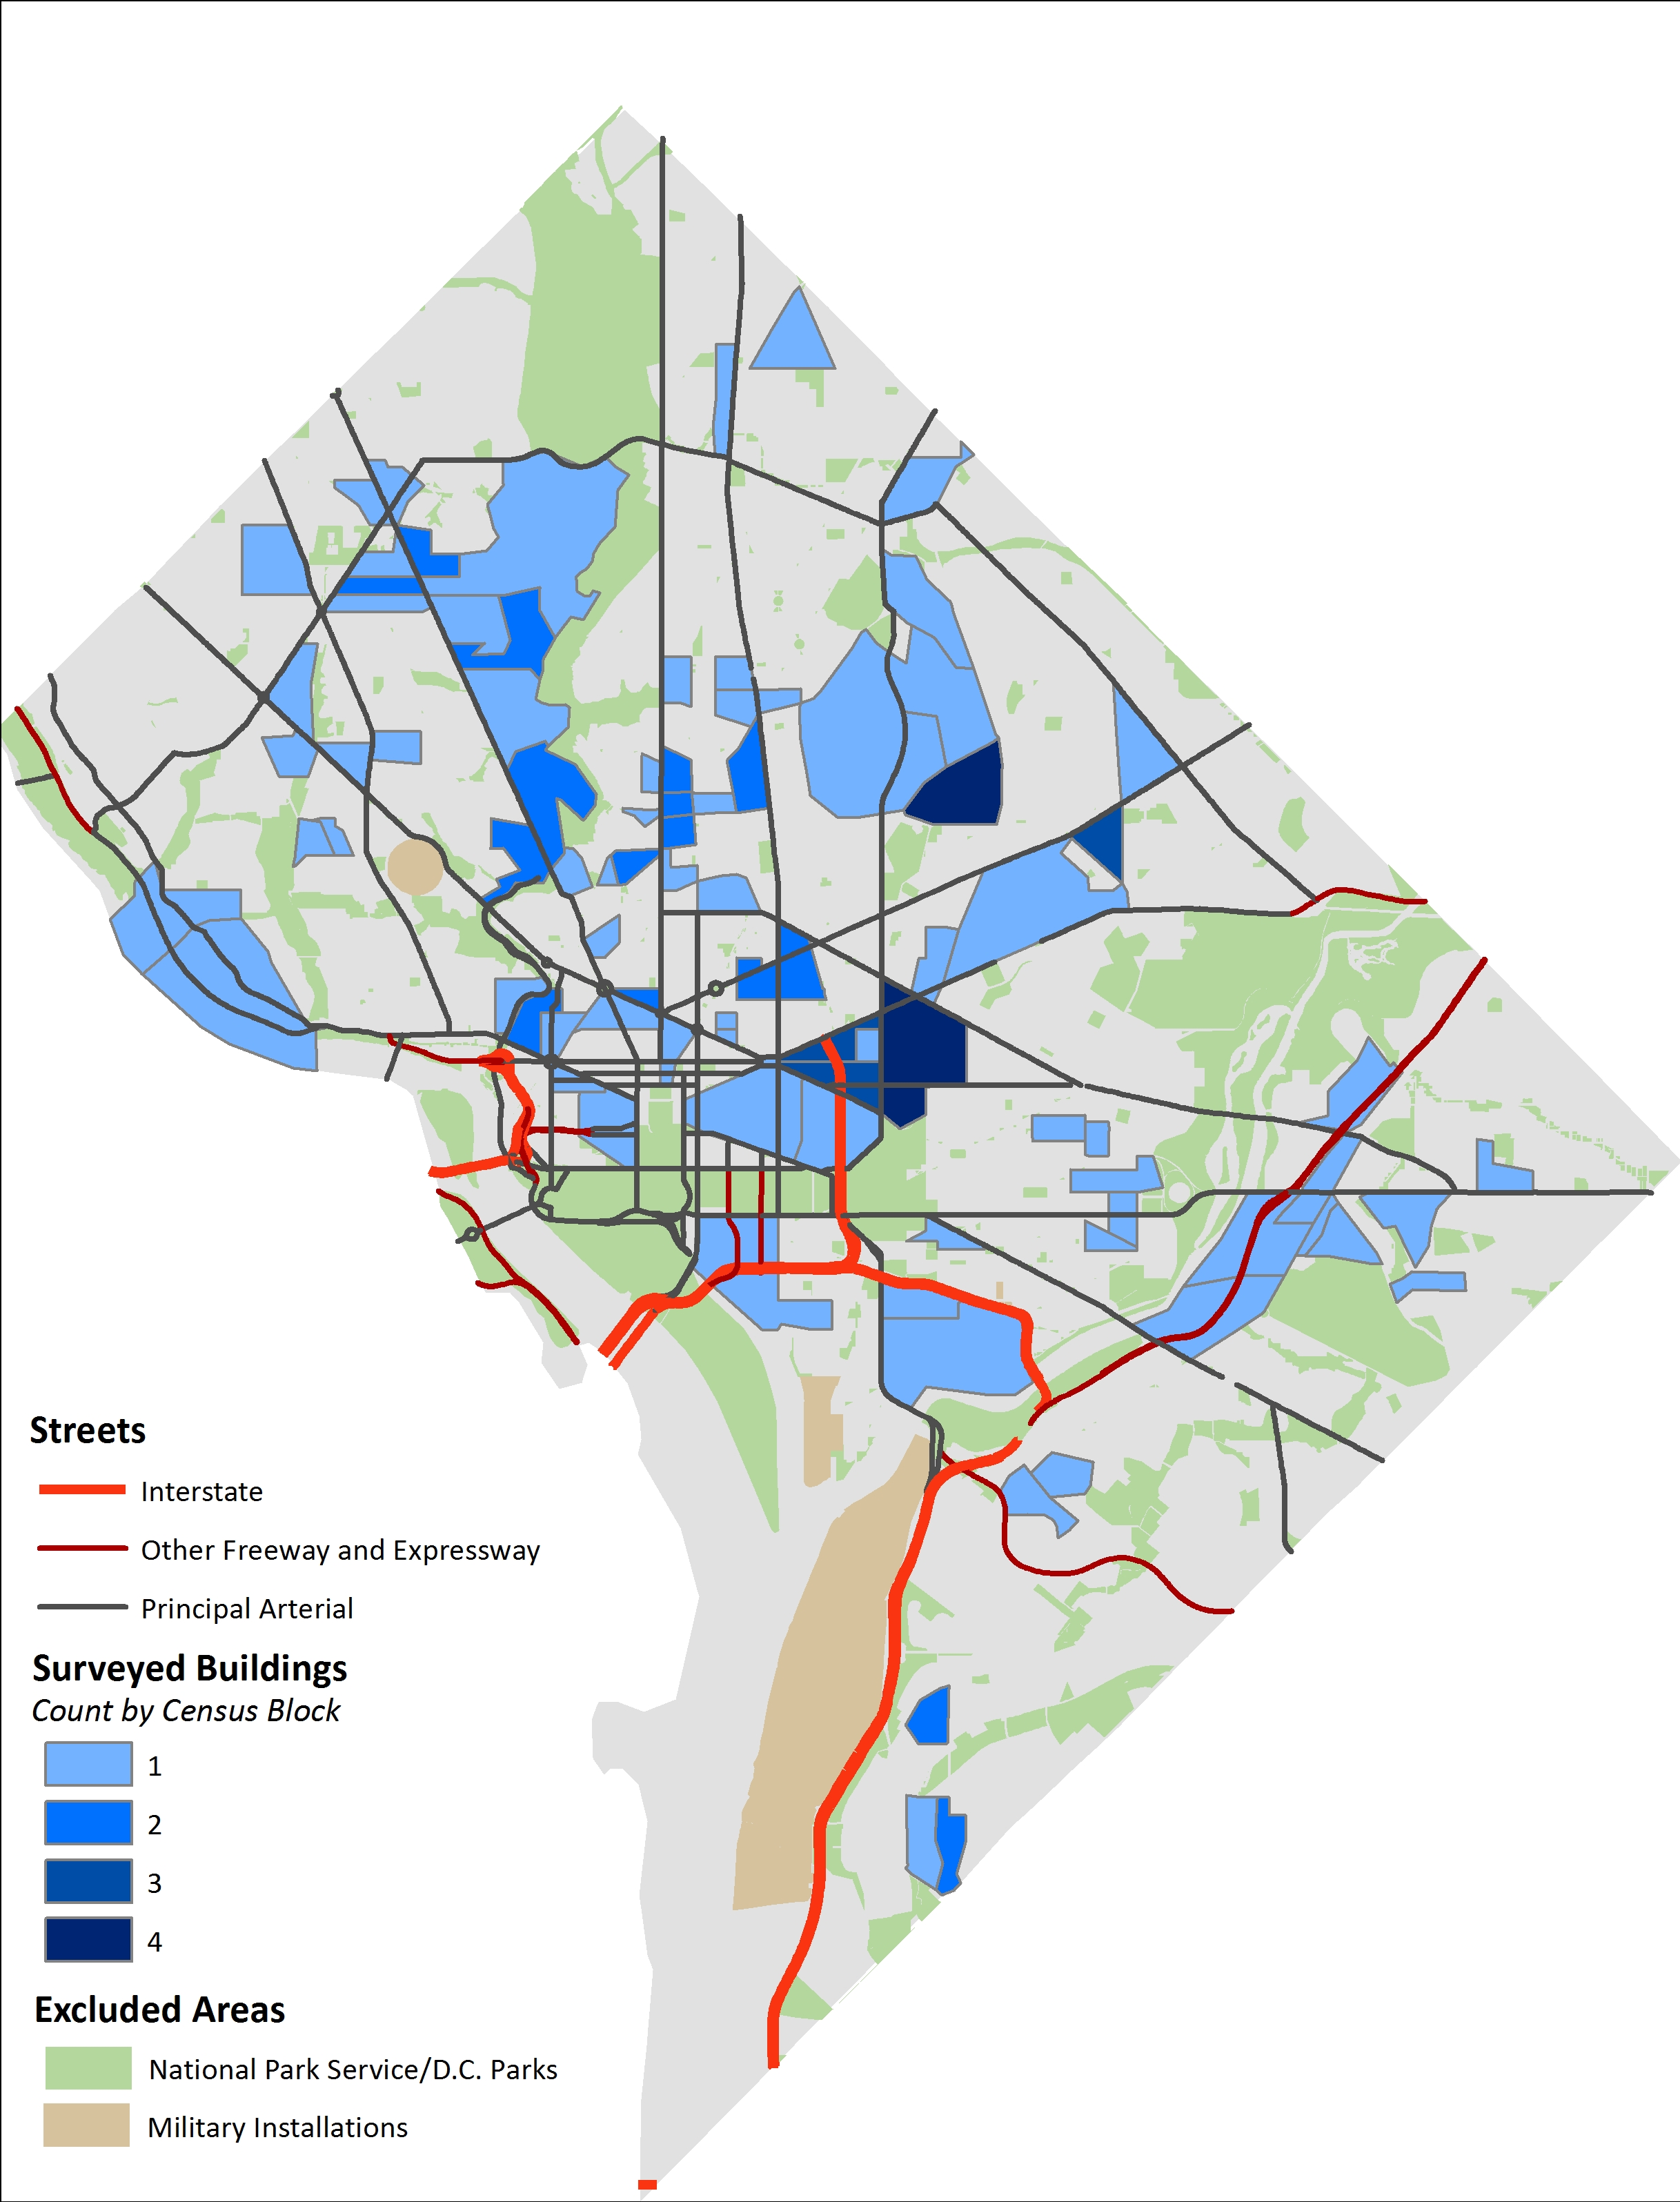
- Geographic Coverage of Calculator:
- To ensure confidence in the model estimates, only properties in the district are covered by the calculator. The sample utilized for data collection covered a wide range of neighborhoods, but all in the District of Columbia. Therefore, the coverage for which model estimates were calculated is limited. The following map shows that approximate location of the surveyed buildings.
- Large Building:
- Eight of the variables in the final model are specific to the building and obtained from field work. Specific data for these variables are not available for all parcels. The calculator uses one of three prototypical building, with values from the field work sample for these variables, as default when you first choose a parcel. By choosing the large building values are automatically input using the specifications from the average of the largest buildings in the surveyed data.
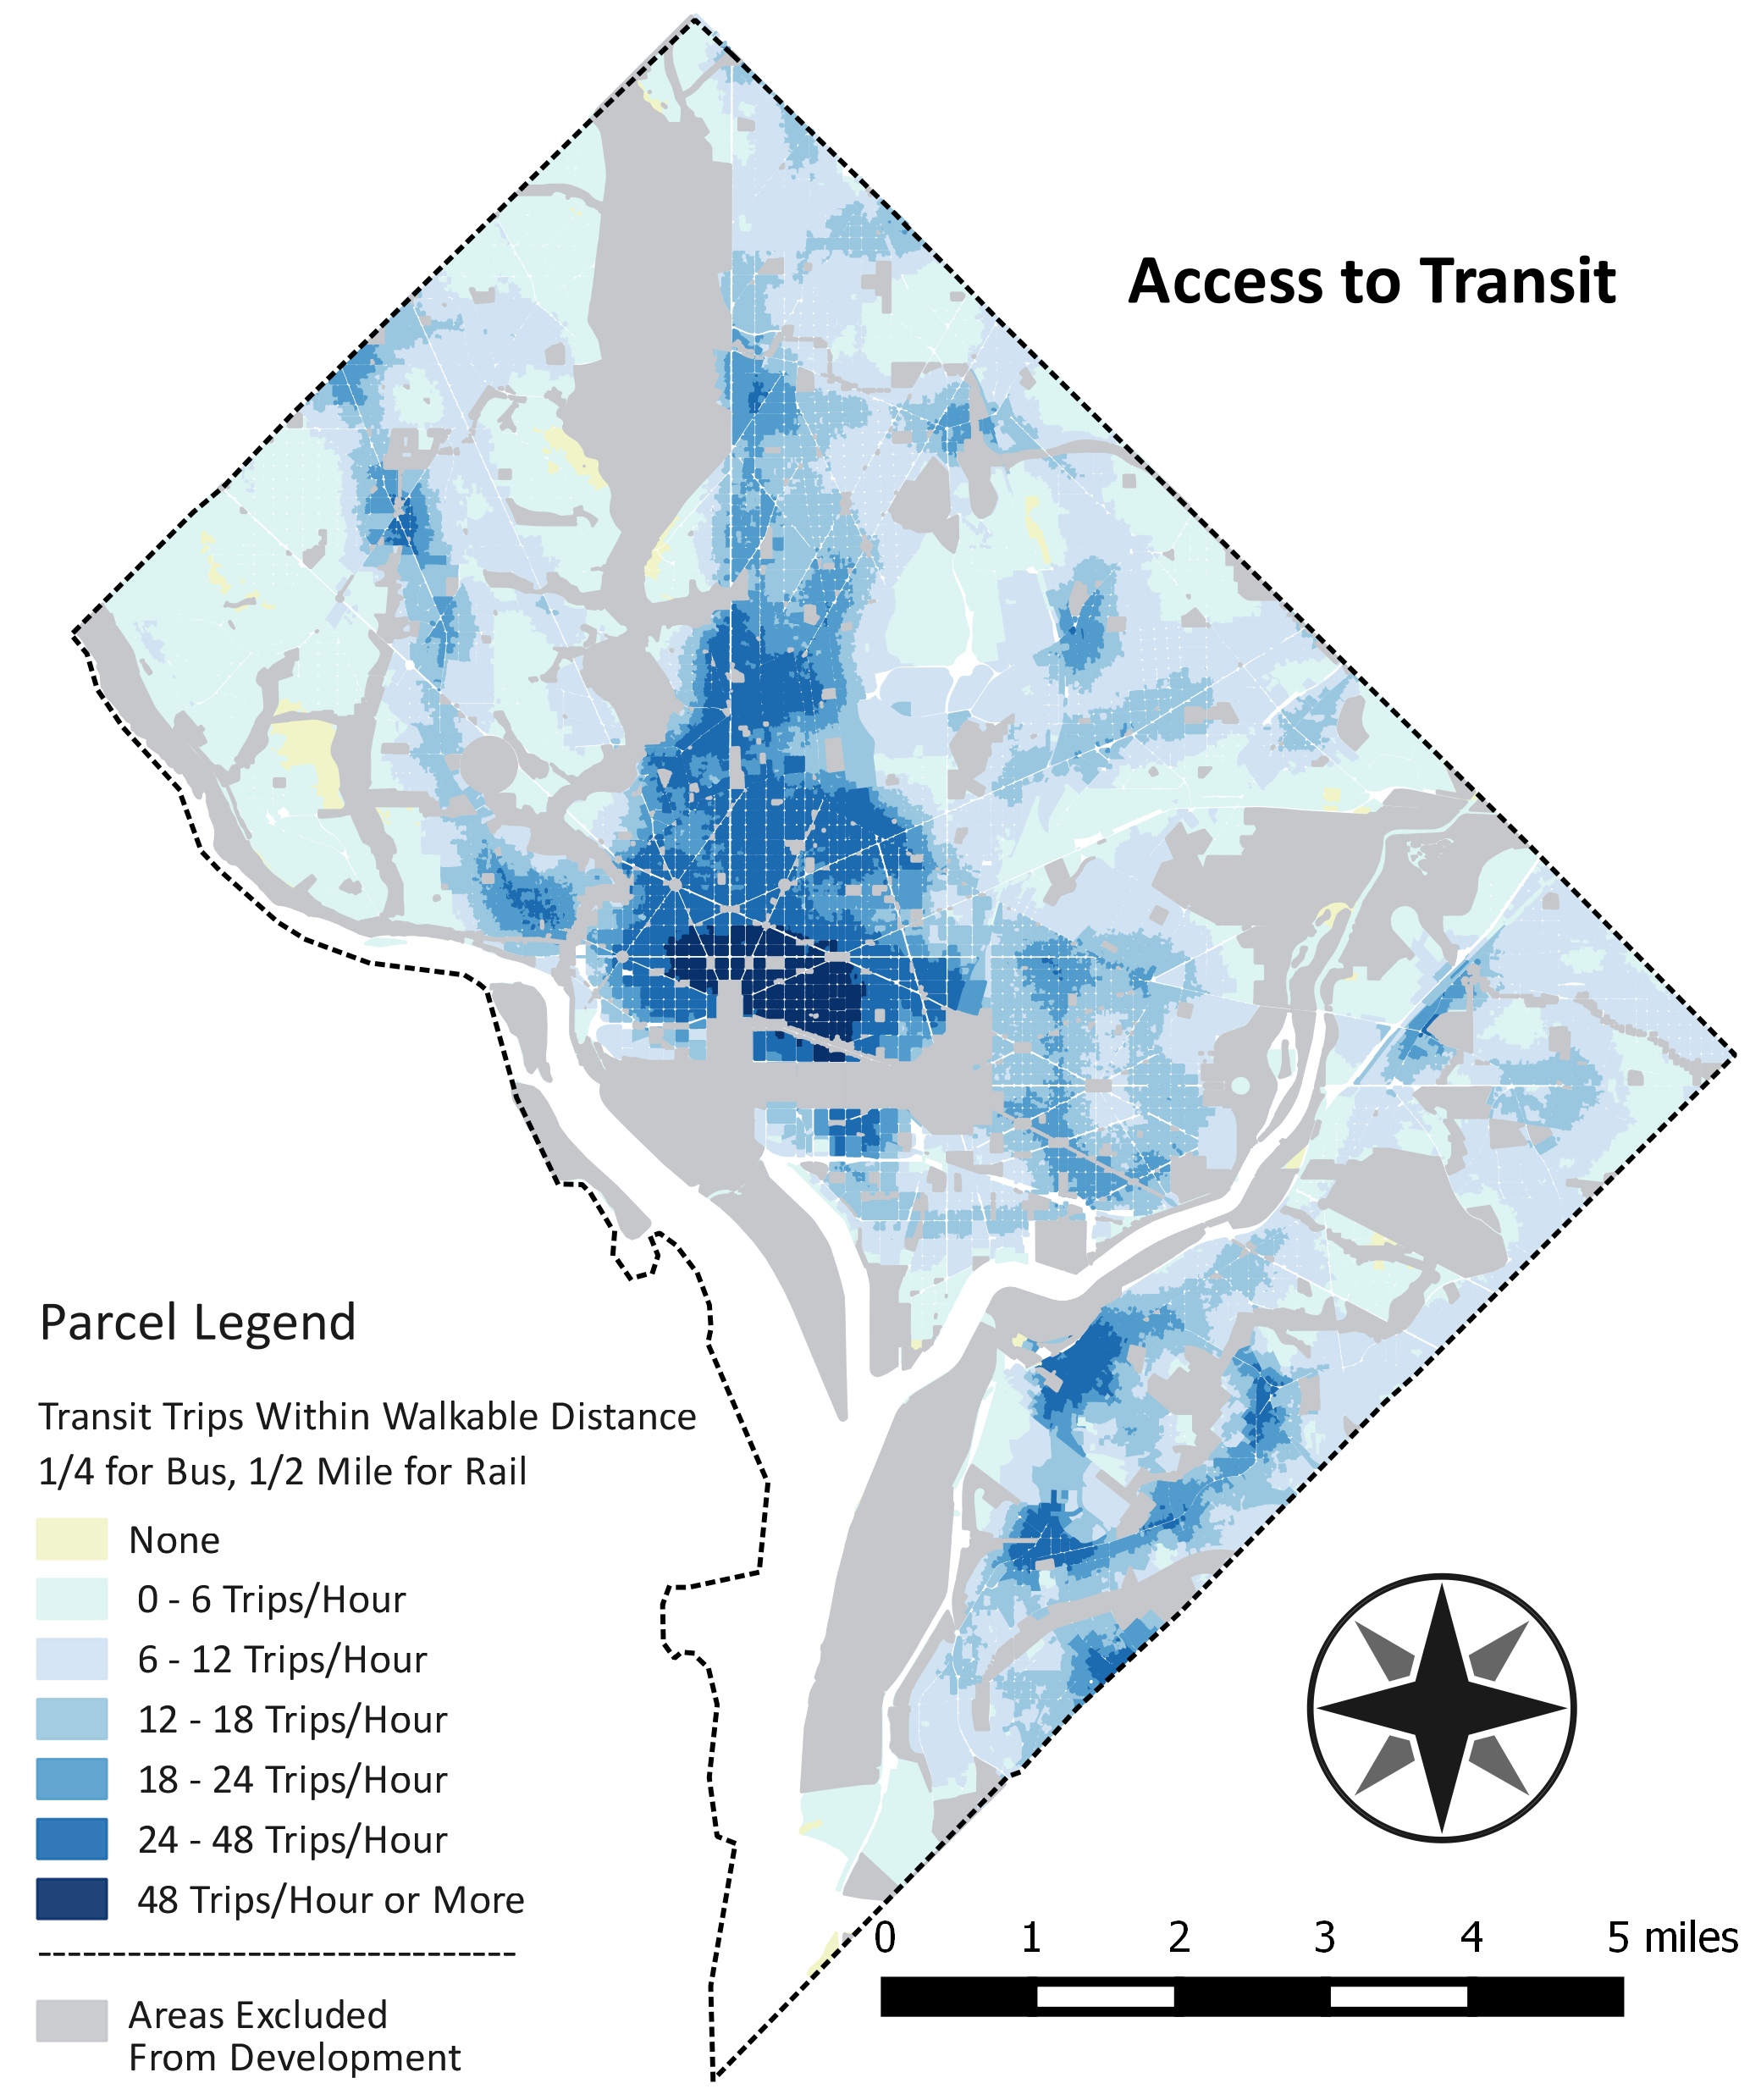
- Location Characteristics - Access to Transit:
- Access to transit is measures using the walking distance from every parcel to nearby bus stop and rail stations. Using the Open Trip Planning package the walking distance from the parcel to each station with in a half mile for buses and a mile for rail is determined. Then only the stations that are within walking distance are considered (1/2 mile for rail and 1/4 for bus). The sum of all trips provided at these stations for the entire week is then divided by 24*7 to get the average trips per day. This quantity is then divided by the area of a 1/4 buffer around each parcel, so as to control for parcel size.
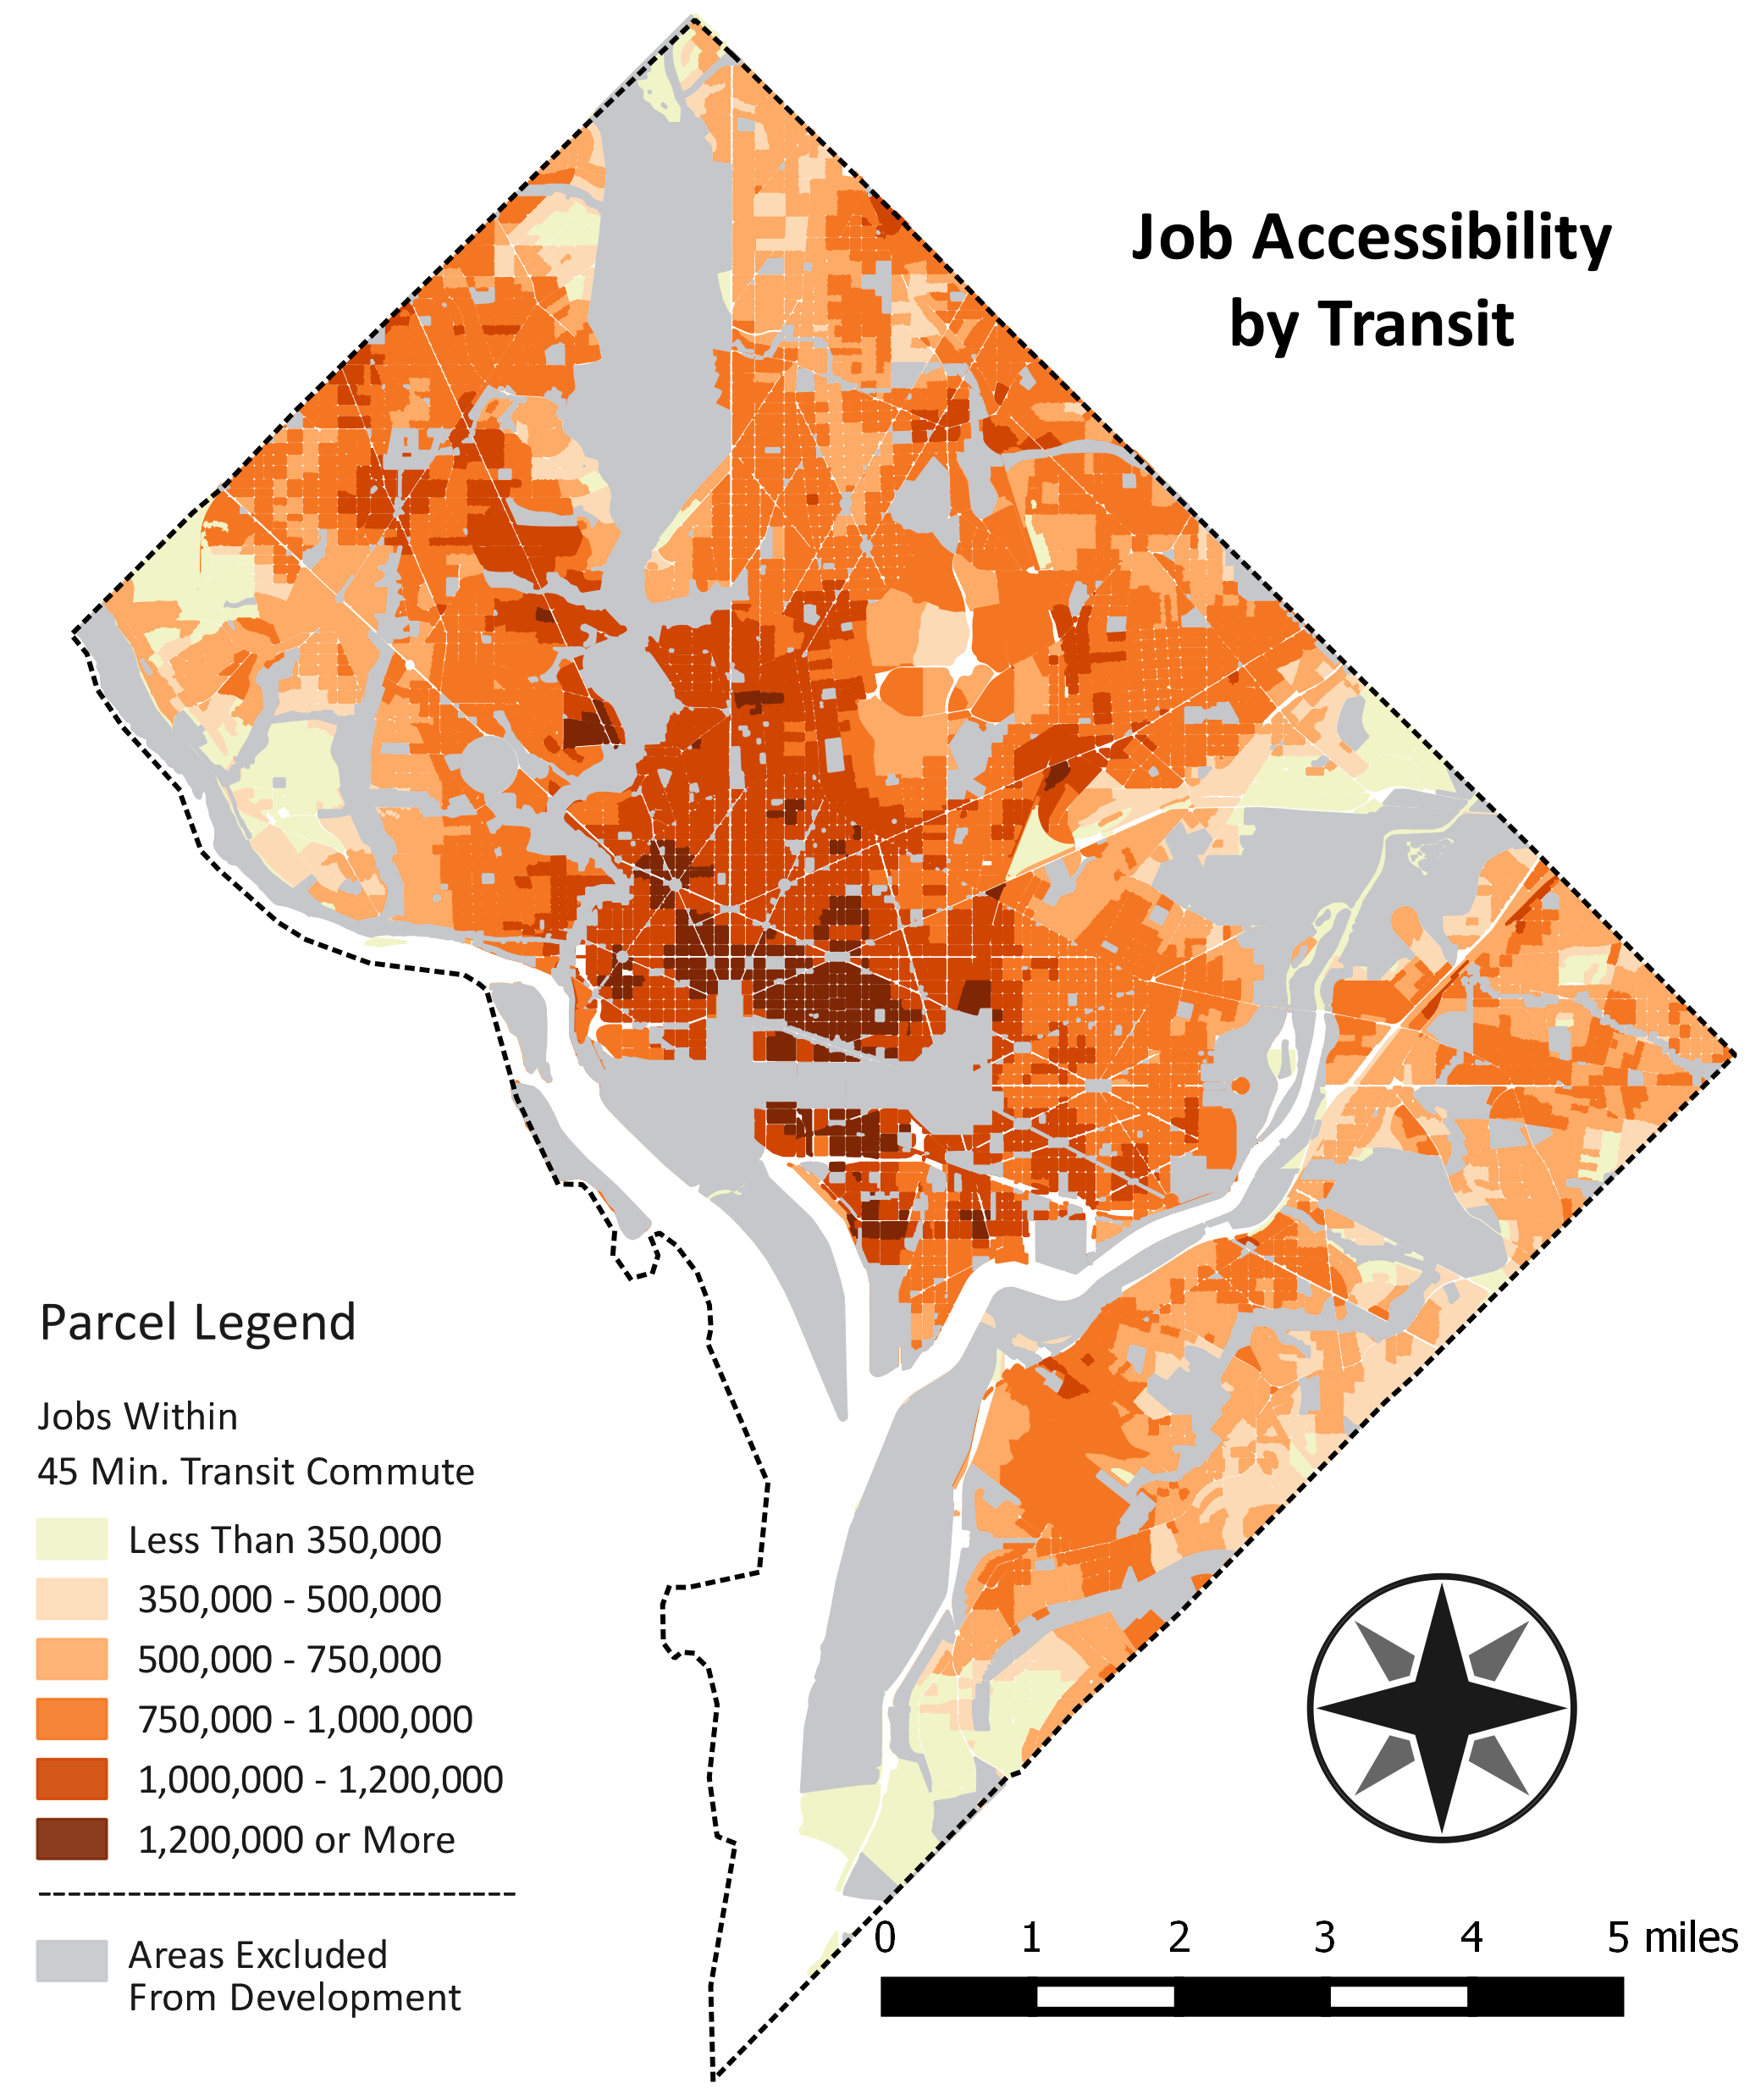
- Location Characteristics - Job Accessibility by Transit:
- The base employment data comes from the Metropolitan Washington Council of Governments by Transportation Analysis Zones (TAZs). Using the Open Trip Planning package the commute time (using transit and walking modes) is determined from every block in DC to every TAZ (within 24 kilometers). The number of jobs in the TAZs that are within a 45 minute walk and transit ride are totaled to create this Job Accessibility by Transit variable.
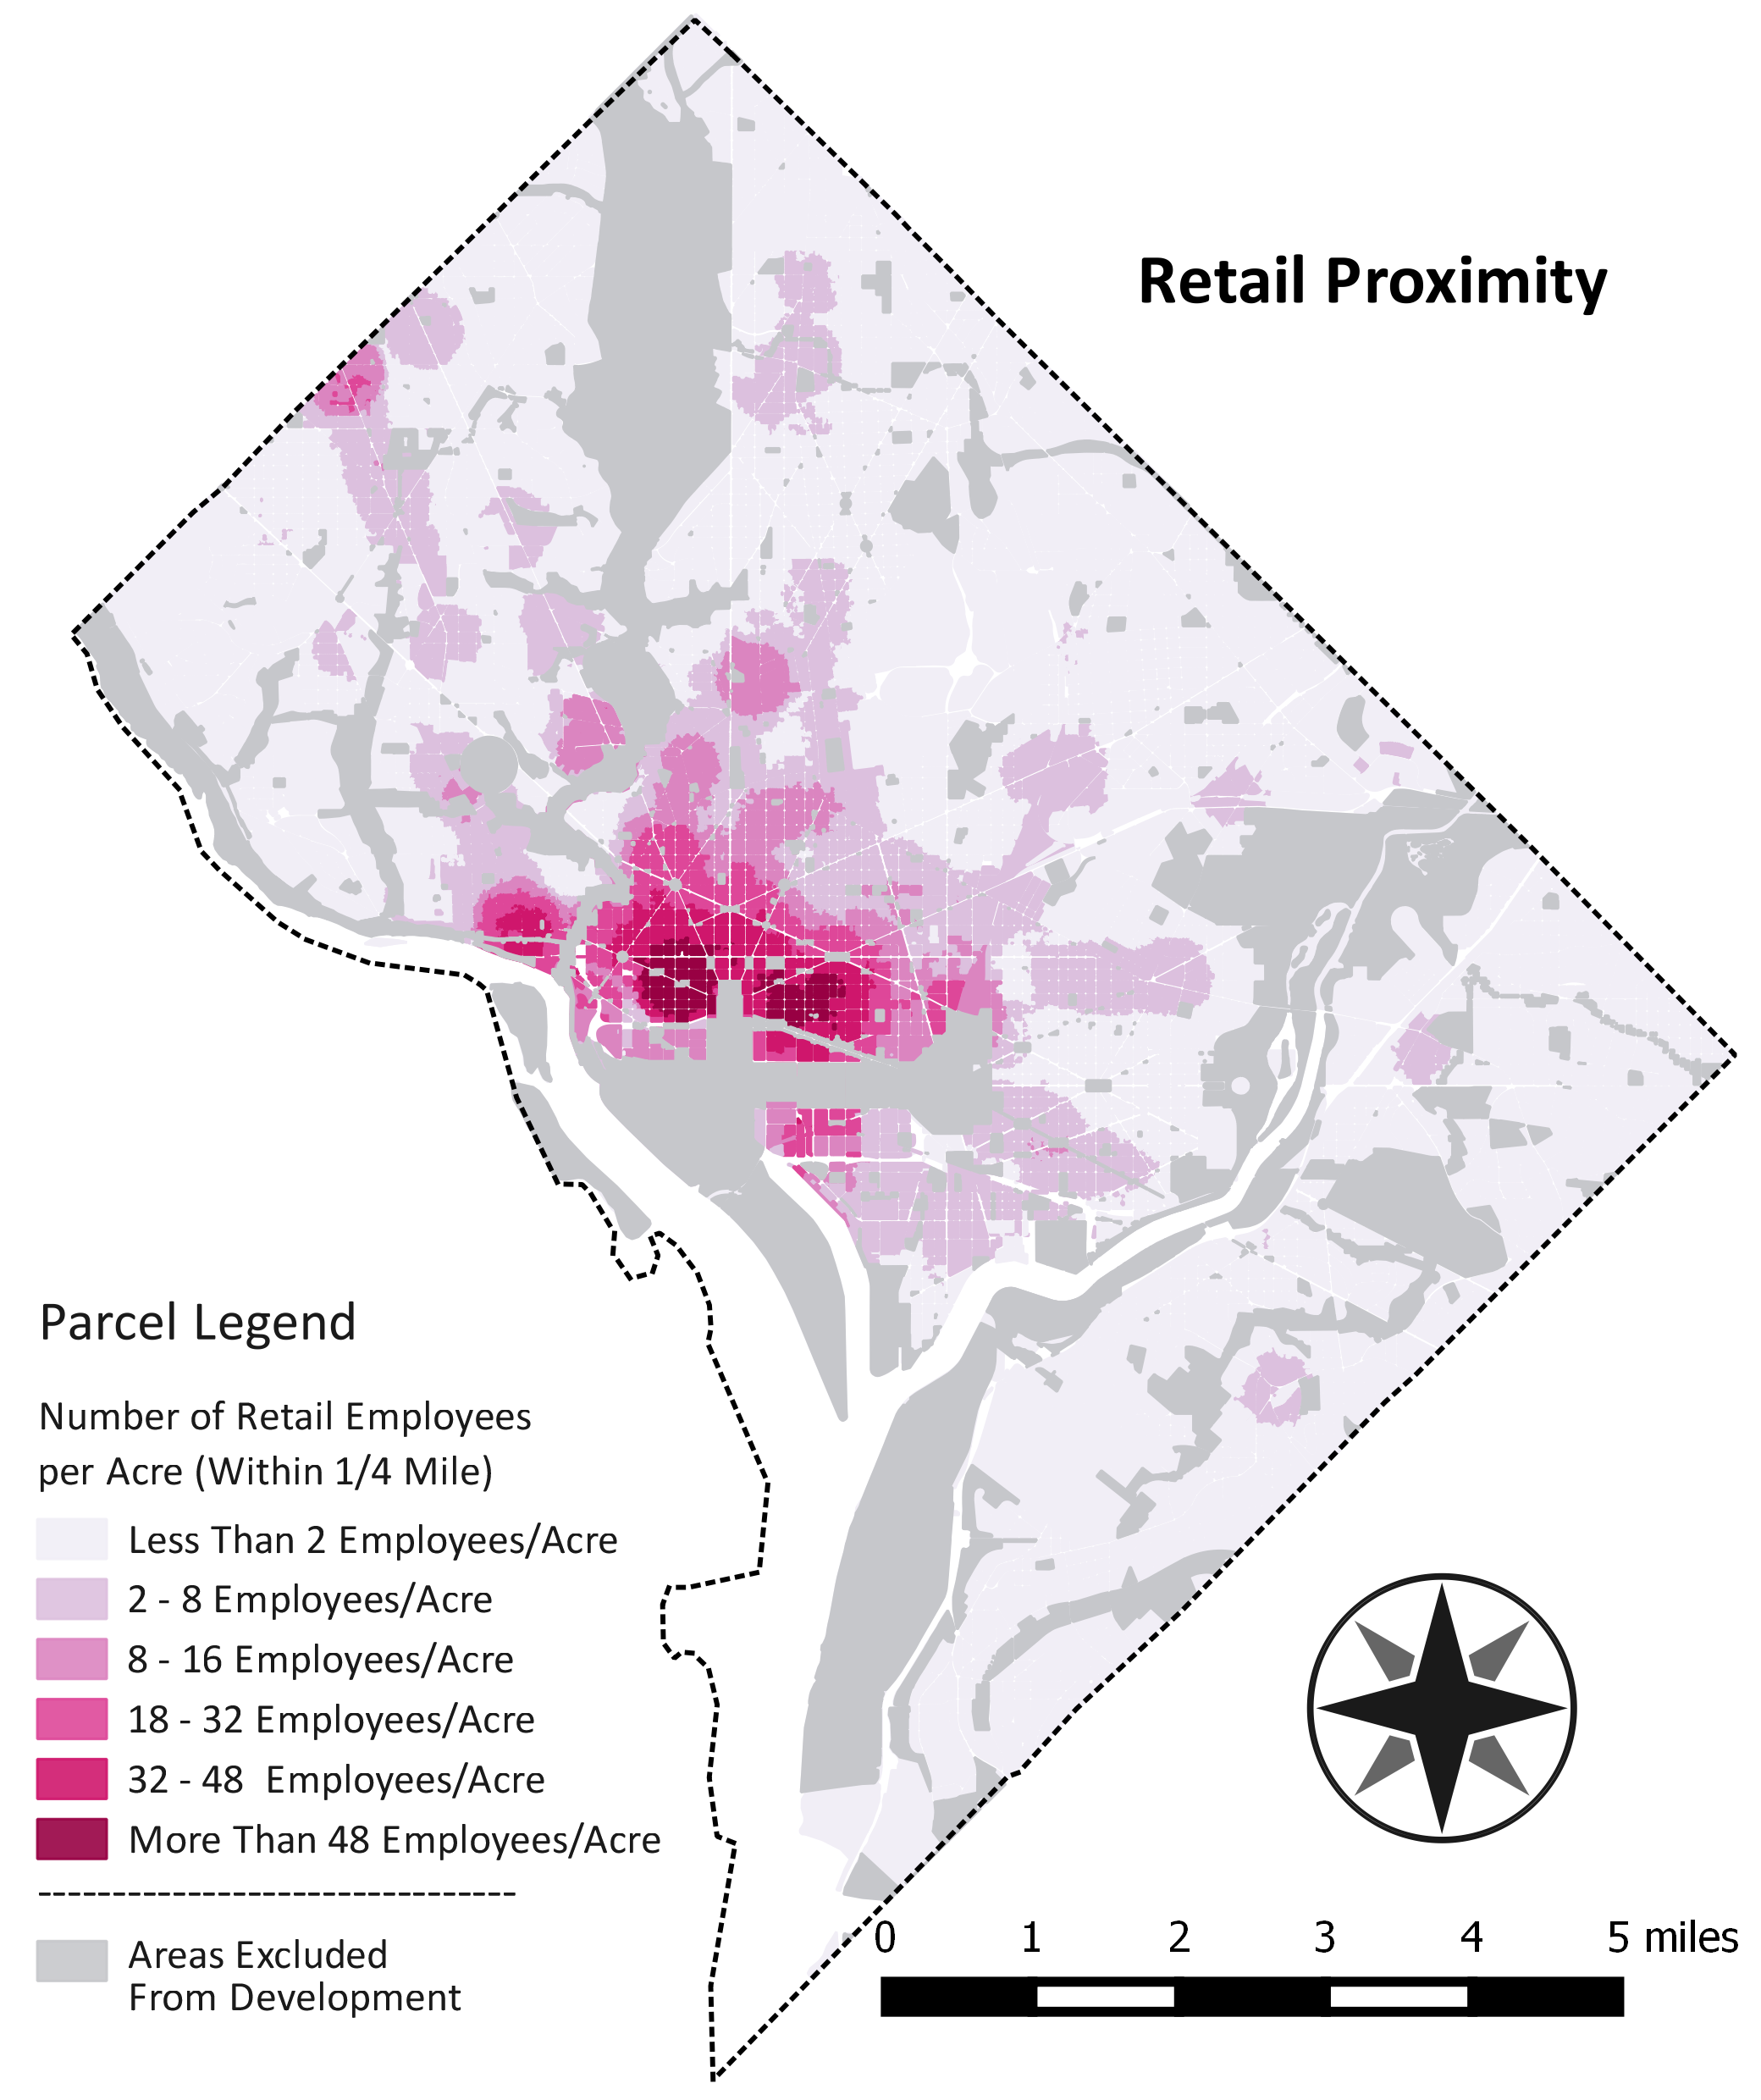
- Location Characteristics - Retail Proximity:
- Using employment data provided by the DC Office of Planning, employment establishments with NAICS two digit codes that included employment by:
- Accommodation and Food Services,
- Arts, Entertainment, and Recreation, and
- Retail
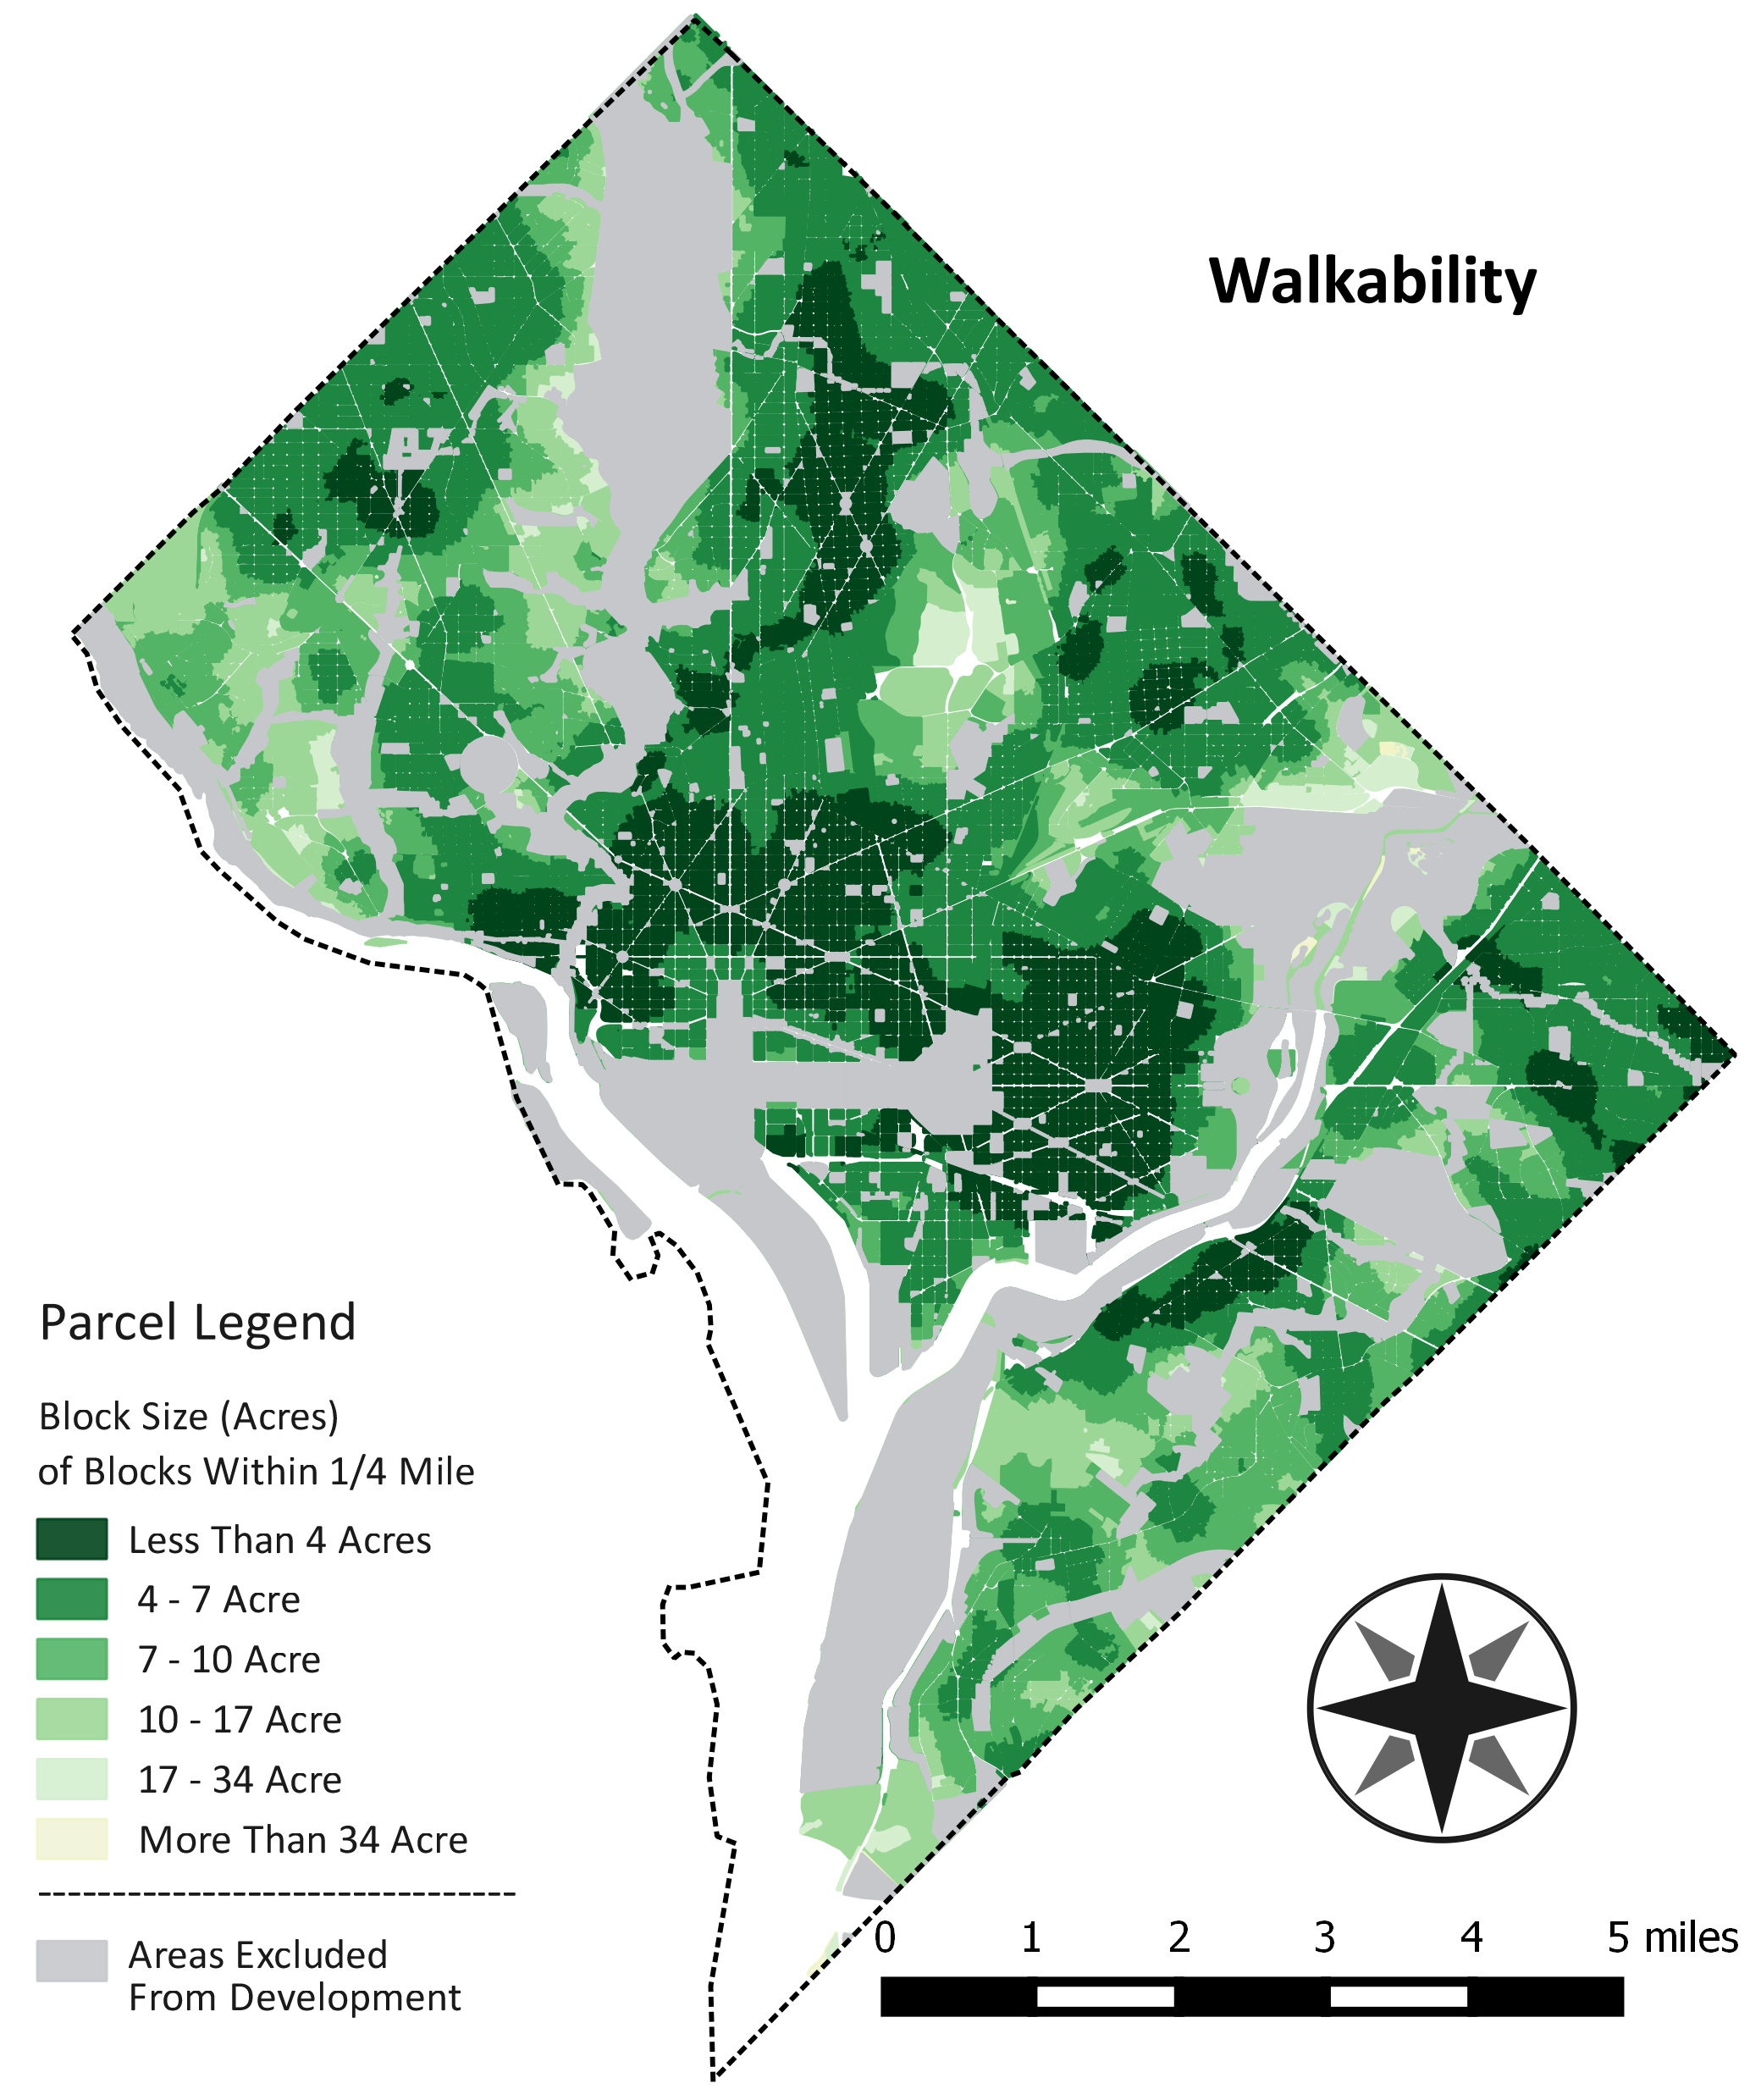
- Location Characteristics - Walkability:
- The best measure of walkability found that was correlated to parking utilization is the size of the city blocks in the nearby community. Several other measures were explored, including intersection densit, link to node ration, and others, but block size gave the most statistically significant results. Using all the blocks that intersect a 1/4 buffer around the parcel was used as the Walkability variable.
- Medium Building:
- Eight of the variables in the final model are specific to the building and obtained from field work. Specific data for these variables are not available for all parcels. The calculator uses one of three prototypical building, with values from the field work sample for these variables, as default when you first choose a parcel. By choosing the large building values are automatically input using the specifications from the average of the medium buildings in the surveyed data.
- Parking Price:
- The monthly price of parking per stall charged to the tenant. In properties with unpaid parking, this value is zero. Observations show that as parking price rises, parking/unit ratio goes down.
- Parking/Unit Ratio, Estimated Average (dependent variable):
- The modeled value predicting parking use per residential unit based on the parcel’s Building & Parking Specifications and Location Characteristics. The value is expressed as x parking spaces per multi-family dwelling unit.
- Parking Utilization Range:
- This range represents the modeled parking utilization plus and minus the 95% confidence level from the estimated standard error (standard error * 1.96). Note that a 95% confidence interval is defined as the range of values for a given parameter where the population of that parameter will to fall within the interval estimates 95% of the time (See Wikipedia Confidence interval article).
- Rent, Average (variable):
- Obtained from property managers, average rent represents the average monthly tenant rental costs of all residential units in the building (excluding parking costs). Observations show that as average rent goes up, parking/unit ratio goes up.
- Strength of Estimate:
- Using the standard error of the predicted value from the model, a 95% confidence interval was calculated (standard error * 1.96). Therefore, a stronger estimate will be represented with a smaller confidence interval, or +/- a smaller number. Note that a 95% confidence interval is defined as the range of values for a given parameter where the population of that parameter will to fall within the interval estimates 95% of the time (See Wikipedia Confidence interval article).
- Small Building:
- Eight of the variables in the final model are specific to the building and obtained from field work. Specific data for these variables are not available for all parcels. The calculator uses one of three prototypical building, with values from the field work sample for these variables, as default when you first choose a parcel. By choosing the large building values are automatically input using the specifications from the average of the smallest buildings in the surveyed data.
- Transit Service, Gravity Measure (variable):
- All transit stops and stations, scaled by the frequency of service, and then summed by the value to each parcel based on the distance from the parcel. Observations show that transit service has a strong correlation with parking/unit ratio (which goes down as transit service goes up). Transit data were updated and current as of May 2012, and include all public transit service in the Washington DC area.
- Unbundled Parking:
- Represents a practice to charge the cost of parking to the multi-family tenant on a monthly basis separately from the cost of their rent.
- Units average square feet
- Obtained from property managers, residential square feet per unit is calculated as total residential area (square feet) divided by units of the development. Observations show that as residential square feet goes up goes up the parking/unit ratio also goes up.
A project in collaboration with DC Office of Planning and the Center for Neighborhood Technology. Contact Us.