How to Use the Calculator
The Park Right DC Parking Calculator allows you to view estimated Parking Stall Ranges for multi-family developments throughout the District of Columbia. The calculator is based on a powerful model developed from current local data of actual parking use. While it is intended to help support and guide parking supply and management decisions, it should not be viewed as a definitive answer. Rather, it should be seen as a resource to inform discussions, weigh the factors impacting parking demand, and help consider the proper provision of parking.
For any location selected, users are encouraged to develop scenarios and view the influence on Parking Stall Ranges by adjusting the model inputs.
See below for instructions:
Find your Area
Enter a location above or use the zoom and pan tools on the map. To select parcels, you must zoom in close enough to see individual parcels boundaries. Once you’re close enough, the selection tools in the upper right of the map will become active.
Select your Parcel(s)

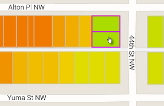
Click the “Select” button and click on the parcel(s) you’d like to inspect. You will see a parking/unit estimate appear in the box above. To unselect a parcel, click the parcel a second time and then click “Remove parcel.” To unselect all parcels click the “CLEAR” on the top menu bar.
To select a larger area:
Neighborhood: Use the “Select Area” drop down
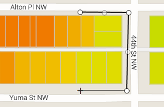
Custom Area: Click the “Draw” button and create a custom area to select parcels. As you are selecting parcels, the parking/unit estimates will assume one building (as defined in the Building and Parking Specifications tab) on each parcel. If you wish to build one building on multiple parcels, click the “Merge” button. The “Merge” button allows you to combine multiple parcels regardless of their contiguity. This feature is only meaningful when merging adjacent parcels.
Creating Scenarios
Once you have selected the parcel(s) of interest, you have the option to click through the “Building and Parking Specifications” and “Location Characteristics” tabs to adjust the default inputs.
You may select a pre-defined Large, Medium or Small building or select Custom to define the building specifications yourself.
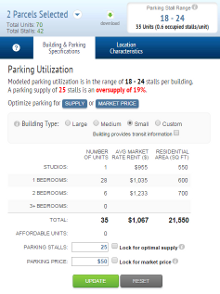
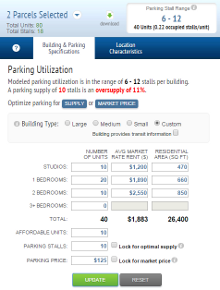
Optimizing Supply and Price
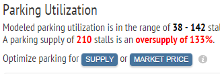
Once you have a location and a building scenario, there is information about the estimated parking utilization. If there is a mismatch between supply and utilization, you will be prompted to optimize. To determine a supply that will be in line with the price click the blue SUPPLY button. To determine the market price for this supply click the blue MARLET PRICE button.
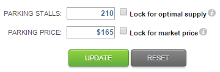
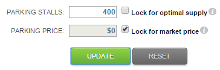
You can also achieve the same results by using the check boxes next to the price and supply input fields. By checking the Lock for optimal supply and clicking UPDATE, the supply will be adjusted to find the optimal supply for the given price. Similarly by checking the Lock for market price box and clicking UPDATE, price is adjusting to that "Market Price" for the given supply. Note that if the supply is zero the checkbox for Lock for market price will not be active.
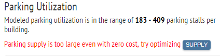
If the supply is too large for a given building and neighborhood there may not be a market price that will be achievable. If this is the case you will be notified in the Parking Utilization message area. If you click the blue SUPPLY button the supply will be adjusted so that the supply and utilization will match for a Market Price of zero.
Location Characteristics
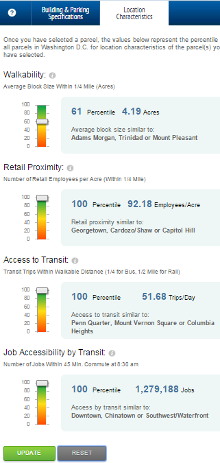
Once you have a location and a building scenario and have adjusted parking supply and price, you explore the effects of location on this building. Under the "Location Characteristics" tab there are four sliders that allow the user to adjust the location inputs. Under each slider is the current value for the for location inputs: Walkability, Retail Proximity, Access to Transit and Job Accessibility by Transit. Also there is a listing of familiar neighborhoods that have similar values. One the slider is slide to a different value, a new list of neighborhoods appears that have similar values to the new chosen value. By clicking UPDATE you will see what affect this change would have on parking utilization.
View Results
Parking Stall Range: The box above will show the estimated parking space utilization for the selected building(s), called the Parking Stall Range. When multiple parcels are selected, it will show an average. To view additional information about the selection, click the down arrow in the purple box.
Selection Info: Click the up arrow in the bottom right for trip generation reduction estimates and Census data on average commute distance and journey to work mode split.
Note: Areas of the map without the Parking Utilization Ratio thematic color map are outside of the model’s geographic coverage.
A project in collaboration with DC Office of Planning and the Center for Neighborhood Technology. Contact Us.